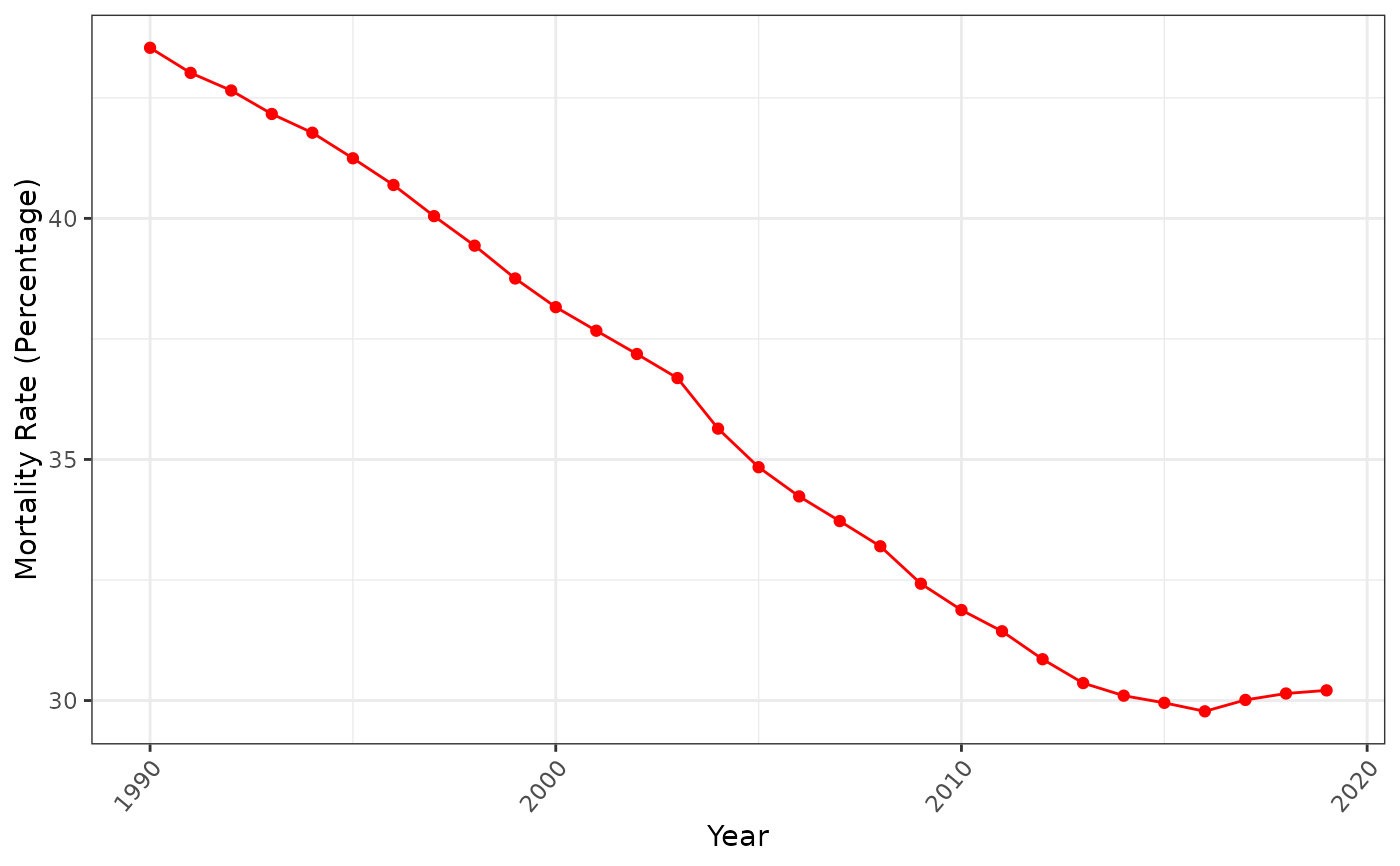
This function plot the mortality rate over time for the disease and country chosen.
For a list of available disease and country refer back to disease_list(), country_list().
Arguments
- disease
A character of disease name you want to see the changes. See a full list of diseases by
disease_list().- country
A character of the country name you want to learn the changes. See a full list of countries by
country_list().
